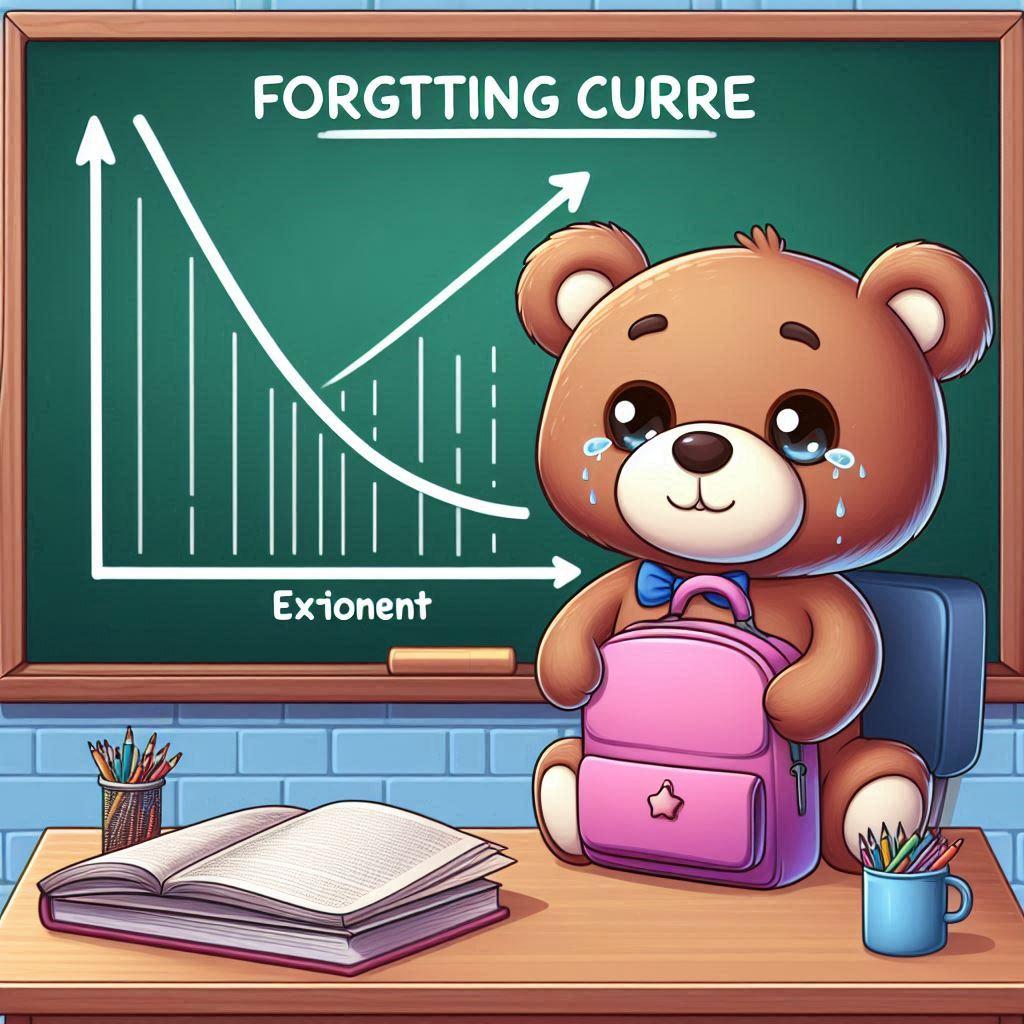
*This article is thought of by team Bearbei, but refined with AI, and the cover photo is ai generated.
Have you ever put significant effort into learning a new concept? You encounter it for the first time, spend time figuring it out, and eventually understand it well enough to store it in a flashcard. Later, you return to the flashcard to review the concept, but the process seems to stop there. How do you know if the knowledge has truly stuck with you? If it has, to what extent do you still remember it? More importantly, how long will it take before you completely forget it?
This is a common problem students face. They may have a vague understanding of the course material, and as the exam approaches, they become unsure whether they can actually pass. This uncertainty can create unnecessary stress, hindering their willingness to learn and taking away the joy and beauty of learning itself.
At Bearbei.com, we've got you covered. By combining learning theories with mathematical formulas, we've developed a method to calculate memory retention.
Here at Bearbei.com, you no longer need to worry about the question, "Do I still remember that concept?" With our memory retention mechanism, you can see the answer with your own eyes.
The idea of the "forgetting curve"
According to the theory of the "forgetting curve" by Hermann Ebbinghaus, memory declines at an exponential rate. This means that your memory of a certain concept will continue to decay over time until it is eventually lost.
Forgetting curve. (2024, May 7). In Wikipedia. https://en.wikipedia.org/wiki/Forgetting_curve
By applying this knowledge to our app, we've developed a brand new mechanism that's a significant step toward personalized learning. By calculating the memory that is expected to decay, we can show students just how well they have retained their knowledge.
How do we implement it into our app
When a student creates a flashcard, we consider it as evidence that they have understood the concept to some extent, with their mental image of the concept initially set at 100%. From that moment on, our app calculates the memory retention in their mind, converting it into a percentage. This allows students to easily see a mathematically calculated result of how well the information remains in their memory.
There are many cases where we've understood a concept but are unsure if we still retain it. Often, we only realize whether we've retained the knowledge when we encounter the concept later. However, this makes it difficult for students to review strategically, potentially hindering their learning experience.
To address this issue, we aim to go beyond simply calculating memory decay. Our goal is to provide a more realistic scenario where, if students review the concept, their mental image of the memory can be restored to, say, 100%—all calculated mathematically.
All students need to do is thoroughly review their flashcards and confirm their review by hitting the bar. Our app will then handle all the complex mathematical calculations and display the updated memory retention status.
But we don't stop there. We recognize that the more a student reviews a flashcard, the more likely they are to retain the information long-term. This means that memory decay slows down with more frequent reviews. To enhance this, we have refined our calculations to account for the number of reviews, improving the accuracy of memory retention predictions.
Additionally, we add visual cues with color coding to show students the current status of their vocabulary, making it easier to see their progress at a glance.
Students can also easily access a simulation of the next 7 days, which shows how their memory is expected to decay based on their current review times and memory retention rate. This feature helps them understand how well their memory will hold up over the short term.
We calculate the average memory retention for each tag (which our app uses as a folder). This provides students with an overview of their general understanding of the data associated with that tag. Depending on how students manage their tags, this could reflect their retention of a specific course or topic.
Next, we calculate the standard deviation of the data within each tag and compare it with the mean retention. Based on this analysis, we provide students with personalized suggestions to help them improve their understanding and retention of the material.
 Check Out Our APP


